Error monitoring in Guidely: keep your Sentry SDK, change one line
Guidely now does error monitoring. Change one line, the DSN, and any Sentry SDK sends errors, traces, release health, cron check-ins and user feedback to Guidely, next to the replays, users and support conversations you already have. No plan fee, no per-seat pricing.
Gurp Parmar6 min read
When something breaks in your product, the answer is usually spread across four tools. The stack trace is in your error tracker. The recording of what the user did is in your replay tool. The message they sent is in your support inbox. And the release that caused it is in your CI logs.
Guidely already had the replay, the user and the support conversation. Today it gets the rest: full error monitoring that accepts data from any Sentry SDK. Errors, performance traces, release health, cron check-ins and user feedback all land in the same place as the people they happened to.
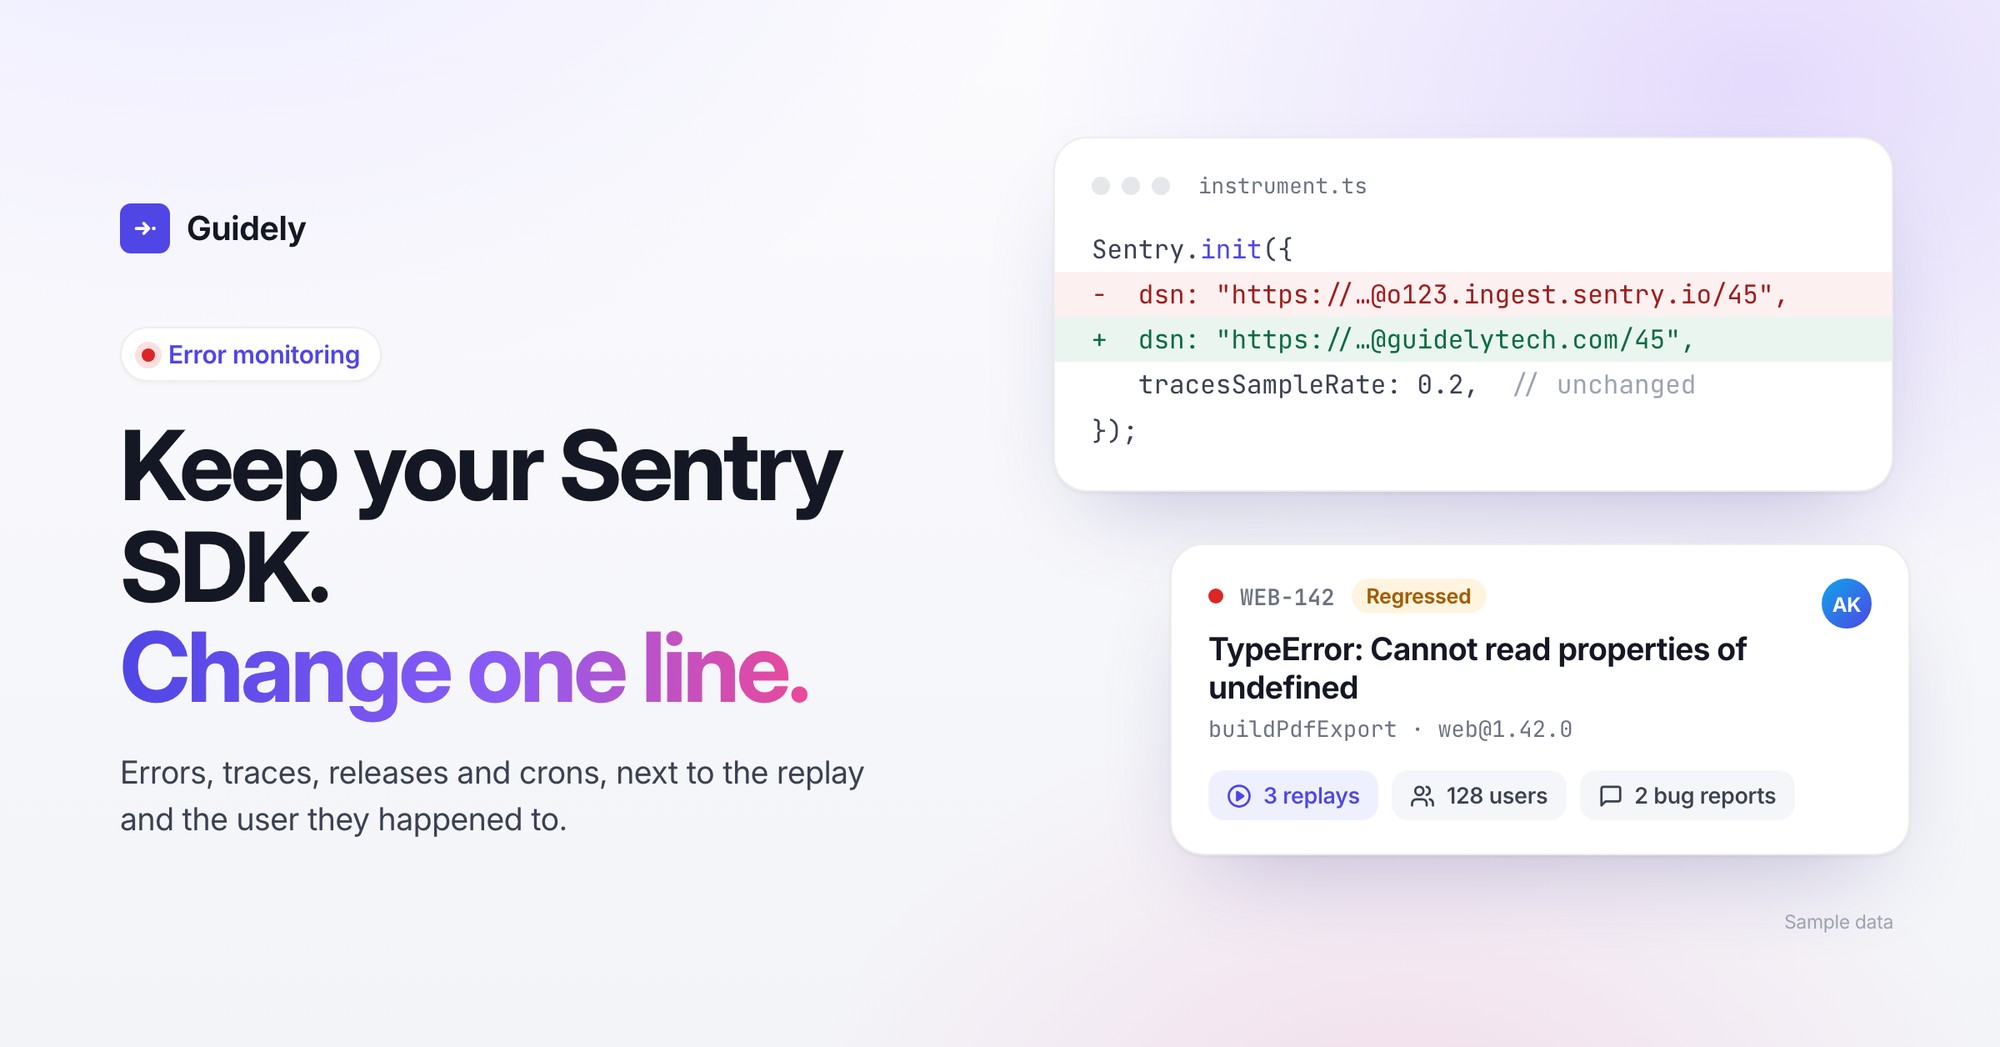
Keep your Sentry SDK. Change one line.
You don't need a new SDK or a migration project. Copy the DSN from Settings → Sentry SDKs and put it where your Sentry DSN was:
Sentry.init({
  dsn: "https://<public key>@<your Guidely API host>/<project number>",
  // everything else stays as it is
});
If you set SENTRY_DSN in the environment, you change only that variable. Your integrations, sample rates, beforeSend hooks, tags, contexts and breadcrumbs all keep working. It's the same one-line change for browser, Node, Python, Go, Ruby, PHP, Java, .NET, Rust, Elixir, iOS, Android, React Native, Flutter and Unity.
sentry-cli works too. Set four environment variables (SENTRY_URL, SENTRY_ORG, SENTRY_PROJECT and SENTRY_AUTH_TOKEN) and your CI keeps uploading source maps, dSYMs and ProGuard mappings and creating releases, now to Guidely. The Vite, webpack, Rollup, esbuild and Next.js plugins work the same way.
Already using Guidely's own SDK for guides or analytics? It reports errors and crashes too, with dSYM and ProGuard symbolication for mobile apps. You can use either SDK, or both in the same project.
Issues you can act on
Errors are grouped into issues by their innermost in-app frame, with a short id like WEB-142 and a readable stack trace from your source maps. Search them the way you'd expect, for example is:unresolved release:web@1.42.0 browser:Chrome, then assign, resolve or ignore.
Each issue shows more than the stack trace:
The replay behind the error. Recordings from Guidely's session replay or Sentry's Session Replay are linked to the errors that happened in them, so you can watch what led up to it.
What the user said. Bug reports from the Sentry feedback widget, the crash-report dialog or Guidely's Report a bug dialog arrive with the issue they're about, next to the user's details and their replay.
Who it happened to. The SDK's
user.idbecomes the Guidely user, so a backend error links to the same person as their frontend sessions, page views and account.AI issue analysis. Turn it on for a project, then ask for a summary, root cause or suggested fix on any issue. It reads the stack trace, breadcrumbs and user reports, with secrets scrubbed, and writes it up for you to check.
Performance, releases and monitors
Tracing. Page loads, navigations, requests and database queries are shown as a waterfall, following a request from the browser to your backend. You get Largest Contentful Paint, Interaction to Next Paint and Cumulative Layout Shift for each page, from real users. Problems found in traces open as issues, and you can jump from an error to the trace it happened in to see the slow query or failed request around it.
Release health. Each release shows crash-free sessions and users and its adoption, with its commits from GitHub. Suspect commits point at the change most likely behind a new issue, and you can open a GitHub issue from there.
Cron and uptime monitors. Cron monitors expect a check-in on schedule and open an issue when a job is missed, fails or runs too long. Sentry.withMonitor, captureCheckIn and the Celery integration work unchanged. Uptime monitors check your URLs every 1 to 60 minutes and tell you when one goes down or its TLS certificate is about to expire.
Alerts where you already are
Issue alerts fire when an issue is new, comes back, escalates or happens often. You can filter them by environment, tag, level or release.
Metric alerts take a warning and a critical threshold on a number like error count, latency or crash-free sessions, and send a message when it recovers.
A weekly summary arrives on Monday with new and frequent issues for each project, for every teammate who turns it on.
Slack. Alerts posted by the Guidely app have buttons to resolve, ignore and assign, and the message updates in place to show who did what. Each person can get their own alerts as DMs, pasted Guidely links unfurl, and
/guidely issuelooks an issue up without leaving the channel.
You can also ask your coding assistant. Guidely's MCP server lets Claude, Cursor or ChatGPT list errors, open one with its stack trace and resolve it when you tell it to. "Why are PDF exports failing since this morning?" becomes a question you can ask from your editor.
Switching from Sentry
Settings → Sentry SDKs → Import from Sentry connects to sentry.io (US or EU) or your self-hosted Sentry with an auth token. You match each Sentry project to a Guidely one and choose what to bring:
Alert rules come across turned off, so nobody gets alerted twice while Sentry is still running. The import lists, rule by rule, anything that didn't carry over.
Cron monitors keep their slugs, schedules and thresholds, so check-ins match them as soon as the DSN is swapped.
Releases come across, the 100 newest per project.
Members arrive as invite suggestions with a matching role. Nobody is invited until you click Invite.
The token is stored encrypted only while the import runs, and deleted when it finishes. You can run the import again whenever you like without creating duplicates.
Each project has its own DSN, so you can move one app at a time: swap it, check it in Guidely, then move the next.
A few things work differently, and we'd rather you know before you start:
Issue history stays in Sentry. Issues in Guidely start with the first event Guidely receives, so keep Sentry readable for as long as you need the old history.
Sentry's Loader Script loads its configuration from Sentry and can't be pointed elsewhere. Use the npm package or Sentry's CDN bundles with
Sentry.init({ dsn })instead.Commits from old releases stay in Sentry. New releases get theirs from
sentry-cli releases set-commitsor the GitHub integration.
Pricing: less than Sentry at every volume
There's no plan fee and no charge per seat. Every month includes 10K errors, 10M performance spans, 5 cron or uptime monitors and 2 GB of attachments for free (the Free plan includes 5M spans). After that you pay only for what you send, and each product has a billing limit you set.
From December 2026, our rates are below Sentry's Team plan at every volume tier, both pay-as-you-go and reserved, checked against Sentry's published prices. A test in our codebase fails if a price change ever breaks that. For example, at 100K errors a month:
Guidely: $22.50. The first 10K are free, then 90K at $0.00025 each.
Sentry Team: about $47. That's the $29 plan fee plus pay-as-you-go errors beyond the 50K it includes.
When an allowance or billing limit runs out, Guidely sends the same 429 and rate-limit headers Sentry SDKs already understand. Your SDK backs off instead of retrying, and your bill stops where you set it.
The pricing calculator shows the comparison for your own volumes.
Get started
New to Guidely? Create a free workspace and follow Get started with error monitoring.
Coming from Sentry? The switching guide takes you through import, the DSN swap, sentry-cli, crons and alerts.
Want the overview first? Read about error monitoring in Guidely.
Try it on one project this week. It's one line, and you can change it back.