See your backend next to every error
Connect your own Grafana, or Prometheus, Tempo and Loki, and Guidely shows the backend trace, its logs and your metrics on every error, replay, release and incident. Queried live, nothing copied.
Gurp Parmar3 min read
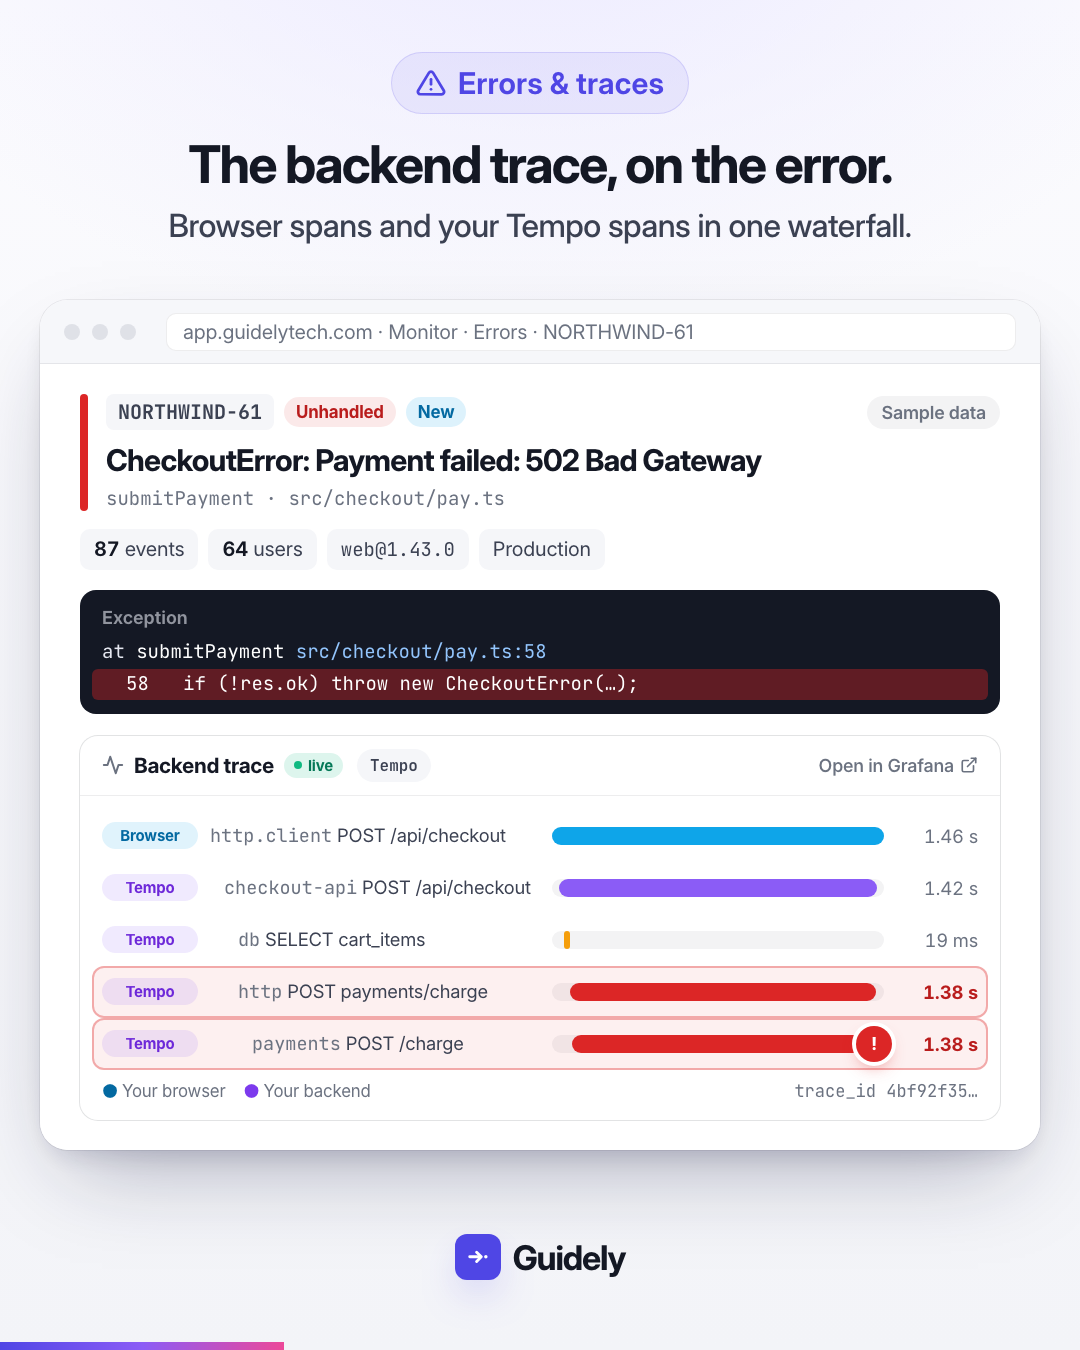
A checkout fails with 502 Bad Gateway. Guidely shows you the error, the user it happened to and a recording of what they did. What it couldn't show you was why. The answer was in your backend: a slow call to a payment provider, a timeout, a log line that said exactly what went wrong. To find it, you opened another tool, lined up the time and copied a trace id across.
Now the backend comes to the error. Connect your own Grafana, or Prometheus, Tempo and Loki directly, and Guidely shows your backend's traces, logs and metrics next to its own data.
What you see on an error
Open any error and a Backend section sits under the stack trace:
The backend trace from Tempo, for the same request. Guidely's browser SDK sends the W3C
traceparentheader, so a backend instrumented with OpenTelemetry continues the same trace.The log lines for that trace from Loki, errors in red.
Your metrics from Prometheus (request rate, 5xx responses and p95 latency by default) for the half hour around the error, with the moment marked.
Every panel has an Open in Grafana link for when you want to dig further.
Everywhere else you debug
Traces: the browser's spans and your backend's spans in one waterfall, with the trace's logs underneath.
Session replays: a Backend tab lists the requests behind what the user saw and their log lines. Click one to jump the recording to that moment.
Releases: request rate, errors and latency an hour either side of each deploy, with a before and after table.
Incidents: what your backend was doing while an uptime monitor was down or a metric alert fired.
AI: AI issue analysis reads the backend trace and logs, and Claude, ChatGPT or Cursor can query your stack through Guidely's MCP server.
Two ways to connect
Connect a Grafana with one service account token, and Guidely uses its Prometheus, Loki and Tempo data sources. Or connect Prometheus, Tempo and Loki directly, with a token, a user name and password, or a header such as X-Scope-OrgID.
If your stack is public, like Grafana Cloud, Guidely calls it directly. If it's on a private network, run the Guidely relay in your AWS, GCP or Kubernetes. It's a small container that only connects out to Guidely over HTTPS, so nothing needs to be opened to the internet. It holds the credentials for your stack, so they never leave your cloud. There's a Docker image, a Helm chart and Terraform for ECS and Cloud Run.
Read-only, and nothing is copied
Guidely queries your stack live when a page opens and shows the answer. It doesn't store your metrics, logs or traces. It only ever calls the query endpoints of Grafana, Prometheus, Tempo and Loki: no writes, deletes or admin APIs, and the relay checks the same list before it sends anything. Who can see backend data is a permission you can turn off per member, and in HIPAA workspaces every look is recorded in the audit log.
Get started
In Integrations, open Grafana, Prometheus, Tempo, Loki and add a connection, or add a relay first for a private network.
In the project's Settings → Observability, pick the connection for metrics, logs and traces, and tell Guidely how each environment is labelled in your stack.
Open an error.
The observability docs cover each step, the relay on AWS, Google Cloud and Kubernetes, and exactly what Guidely can and can't do with your stack.